Lets Learn together... Happy Reading

" Two roads diverged in a wood, and I,
I took the one less traveled by,
And that has made all the difference "-Robert Frost

Template Matching in MATLAB


 The comparison of two images is done based on correlation coefficient. The quantitative measure of the degree of association of two distinct variables is often coined as correlation coefficient, which typically ranges between -1 and 1.


Pearson Correlation coefficient,  

Let’s start with the basics.

Steps to be performed for finding the correlation coefficient between two vectors or matrices.

This denotes that the matrix A and B are highly correlated.

MATLAB CODE:

Example: 1

A= [1 4 7; 2 5 8; 3 6 9]
B = A*2

%Find the average of the matrix A
meanA = mean2(A);

%Find the average of the matrix B
meanB = mean2(B);

%Subtract the average value from matrix A
Asub = A-meanA;

%Subtract the average value from matrix B
Bsub = B-meanB;

%Covariance of matrix A and matrix B
covAB = mean2(Asub.*Bsub);

%Find the standard deviation of the matrix A
stdA = std(A(:),1);

%Find the standard deviation of the matrix B
stdB = std(B(:),1);

%Find the correlation Cofficient
Rho = covAB./(stdA*stdB)


Example: 2

%Assign new values to B
B = [9 6 3;8 5 2; 7 4 1];

Rho = corr2(A,B)


EXPLANATION:
In the first example, both A and B are highly correlated. The correlation coefficient is 1, whereas in example 2, the correlation coefficient is -1.


                  Consider the reference image as template image which will be larger in size and search image as target image usually smaller in size.

In Principles of Digital Image processing, algorithm 11.1(pg.262), a clear explanation of template matching algorithm is given. 


Template Matching using MATLAB command ‘normcorrx2’:

MATLAB CODE:

%Read an Image A(Template)
A1 = imread('benten.jpg');

%Read the Target Image
B1 = imread('watch.jpg');

A = A1(:,:,1);
B = B1(:,:,1);


normx_corrmap=normxcorr2(B(:,:,1),A(:,:,1));

maxptx = max(normx_corrmap(:));
[x1,y1]=find(normx_corrmap==maxptx);
figure,
imagesc(A1(x1-size(B,1):x1,y1-size(B,2):y1,:));axis image

NOTE: ‘normxcorr2’ is the normalized cross correlation.


Template Matching in Spatial Domain:

MATLAB CODE:
A1 = imread('benten.jpg');

%Read the Target Image
B1 = imread('watch.jpg');

A = A1(:,:,1);
B = B1(:,:,1);

corr_map = zeros([size(A,1),size(A,2)]);

for i = 1:size(A,1)-size(B,1)
    for j = 1:size(A,2)-size(B,2)
        %Construct the correlation map
        corr_map(i,j) = corr2(A(i:i+size(B,1)-1,j:j+size(B,2)-1),B);
    end
end

figure,images(corr_map);colorbar;
%Find the maximum value
maxpt = max(corr_map(:));
[x,y]=find(corr_map==maxpt);

%Display the image from the template
figure,imagesc(B1);title('Target Image');colormap(gray);axis image

grayA = rgb2gray(A1);
Res   = A;
Res(:,:,1)=grayA;
Res(:,:,2)=grayA;
Res(:,:,3)=grayA;

Res(x:x+size(B,1)-1,y:y+size(B,2)-1,:)=A1(x:x+size(B,1)-1,y:y+size(B,2)-1,:);

figure,imagesc(Res);


EXPLANATION:

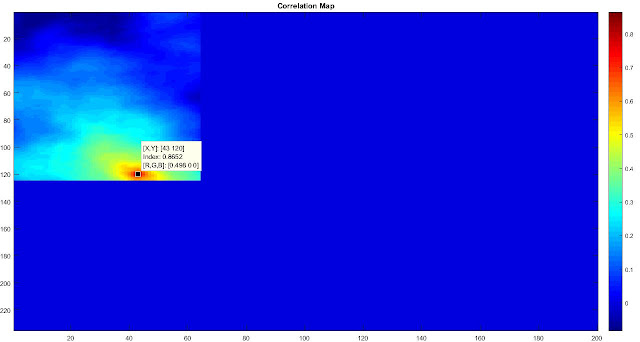
MATLAB command ‘corr2’ is used to find the correlation coefficient. The Target Image is placed over the template image and correlation coefficient for each pixel in the template image is found to construct the correlation map. After sliding through all the pixels in the template image, the maximum coefficient is obtained from the map. The pixel position with maximum value is the starting point of the target image.
In the above example, maximum value is 0.8652 and the pixel positions corresponding to this value in correlation map(x,y) is (120,43)


Template Image


+   


Target Image


=


Template Matching in Frequency or Fourier Domain:

%Read two images of same scene
A = imread('Image1.jpg');
B = imread('Image2.jpg');

figure,subplot(2,1,1);imagesc(A);title('Image 1');axis image
subplot(2,1,2);imagesc(B);title('Image 2');axis image

%Crop a part from the image matrix B
B = imcrop(B,[58.5 49.5 226 102]);
figure,imagesc(B);title('sub Image - Image 2');axis image

%Pad the image matrix B with zeros
B1 = zeros([size(A,1),size(A,2)]);
B1(1:size(B,1),1:size(B,2))=B(:,:,1);

%Apply Fourier Transform
Signal1 = fftshift(fft2(A(:,:,1)));
Signal2 = fftshift(fft2(B1));

%Mulitply Signal1 with the conjugate of Signal2
R = Signal1 .*conj(Signal2);

%Normalize the result
Ph = R./abs(R);


%Apply inverse fourier transform
IFT = ifft2(fftshift(Ph));

figure,imagesc((abs((IFT))));colormap(gray);

Correlation Map


%Find the maximum value
maxpt = max(real(IFT(:)));

%Find the pixel position of the maximum value
[x,y]= find(real(IFT)==maxpt);

figure,subplot(1,2,1);imagesc(A(x:x+size(B,1),y:y+size(B,2),:));axis image
subplot(1,2,2);imagesc(B);axis image


EXPLANATION:

The above implementation is based on normalized cross correlation in Fourier domain.Also known as phase correlation. The two images used here are different snapshots of the same scene.  ‘Image1.jpg’ is used as template image and a sub image from the ‘Image2.jpg’ is used as target image. The target image is padded with zeros to match the size of the template image. After Fourier transform, the template signal is multiplied with the conjugate of the target signal and normalized. Then inverse Fourier is applied and the pixel position corresponding to the maximum value is extracted.

The maximum value is 0.0374 and the pixel positions (x,y) is(59,78). From the correlation map, it is evident that the maximum value is at the pixel position(59,78).


like button Like "IMAGE PROCESSING" page

Identifying the objects based on count(bwlabel)

Identifying the objects based on labeling


Steps To Be Performed:


  1. Convert the RGB image to binary image.
  2. Fill the holes in the image.
  3. Label the objects in the image based on connectivity 8
  4. Display the images in a RGB format
4.1.  Store the co-ordinates(x,y) of the object 1 which is  labeled as 1.
4.2.  Calculate the image size for object one. The length can be found by subtracting the maximum and the minimum of y values. Similary for x find the width by subtracting the maximum and minimum of x values.
4.3.  Now map the pixel value to the new image.


Original Image


A=imread('num2.jpg');
figure,imshow(A);
title('Original image');
C=~im2bw(A);
B=imfill(C,'holes');
label=bwlabel(B,8);
for j=1:max(max(label))

[row, col] = find(label==j);

len=max(row)-min(row)+2;
breadth=max(col)-min(col)+2;
target=uint8(zeros([len breadth 3] ));
sy=min(col)-1;
sx=min(row)-1;

for i=1:size(row,1)
    x=row(i,1)-sx;
    y=col(i,1)-sy;
    target(x,y,:)=A(row(i,1),col(i,1),:);
end
mytitle=strcat('Object Number:',num2str(j));
figure,imshow(target);title(mytitle);
end


The objects that are displayed in a RGB format.


like button Like "IMAGE PROCESSING" page

Image extensions in MATLAB

Graphics Interchange Format
To extract frames from GIF file.
The image is usually an animated GIF file.
The multiframes are read using the syntax: imread(filename, ‘frames’, ‘all’)
To read ‘n’ number of frames from a GIF file: imread(filename, ‘frames’, 1:n)

Example:
Here, the GIF image is an animated file and contains 8 frames.
The frames that are read will be stored in a 4-D format.


 [A,map]=imread('cute.gif','frames','all');
mov=immovie(A,map);
implay(mov);


To animate the muliframes: use  ‘immovie’ to make a movie from the muliframe image.
Play the movie using ‘implay’.

To view a particular frame:

imshow(A(:,:,4),map);  Here the 4th frame is viewed.

To create avi file from the movie:

movie2avi(mov, 'cute_girl.avi', 'compression', 'None','fps',3);
Here frames per second(fps) is 3. 


like button Like "IMAGE PROCESSING" page

Image Shading in MATLAB

         
              Here I tried to shade the RGB image which results in a pencil sketched type image. The user selects the image from the pop-up menu and by adjusting the line value in the slider, the edge thickness is made.
By adjusting the thresh value in the slider the image shade is increased or decreased.
Additional Information:
To make your own pencil sketch without using MATLAB try Autodesk Sketchbook.
Based on the customers review, this software is best to try on low pixel camera images.
Steps To Be Performed:

1.     Input a RGB image
2.     Convert the image to grayscale image.
3.     Find the edges using Sobel Method.[gradient Estimation]
4.     Filter the Image to obtain the image without noise
4.1.          The blurred or unsharp image is subtracted from the image to obtain the sharpened image.
5. Blend the edge and the sharpened image.


MATLAB Code:

function image_shade

The GUI is designed.

global filename A;
scz=get(0,'ScreenSize');
figure('Position',[round(scz(1,3)/4) round(scz(1,4)/8) 700 500],'MenuBar','None','NumberTitle','off','Name','Pencil sketch Application','Resize','off');
axes('Position',[0 0 .7 1],'xtick',[],'ytick',[]);
shade=uicontrol('Style','slider','Position',[500,310 200 20],'Max',1 ,'Min',0.01,'Value',0.56,'Callback',@draw);
thresh=uicontrol('Style','slider','Position',[500,370 200 20],'Max',255,'Min',0,'Value',30,'Callback',@draw);
directory=dir('*.jpg');
files={directory.name}';
tval=uicontrol('style','text','Position',[500,340 100 20]','String','Thresh :');
line=uicontrol('style','text','Position',[500,395 100 20]','String','Line :');
uicontrol('style','text','Position',[500,455 100 20]','String','Filename:');
uicontrol('Style','popupmenu','position',[500 420 160 30],'Value',1,'String',files,'Callback',@displayfile);

    function displayfile(obj,~)
        ptr=get(obj,'value');
        filename=char(files(ptr));
        A=imread(filename);                      
        imshow(A);
    end
    function draw(~,~)
       
        sh=get(shade,'Value');
        thr=get(thresh,'Value');
        thval=strcat('Thresh :', num2str(sh));
        set(tval,'String',thval);
       
        lineval=strcat('Line :', num2str(thr));
        set(line,'String',lineval);
       if(~isempty(A))
        A=imread(filename);
        B=rgb2gray(A);


The Edge of the image is detected using the sobel edge detection method.


C3=~edge(B,'sobel','VERTICAL');
C2=~edge(B,'sobel','HORIZONTAL');
C=uint8(C3.*C2);

The image is sharpened by subtracting the blur image.

F1=uint8(imfilter(B,fspecial('unsharp')/sh));

The blending of the edge and the filtered image is done.

for m=1:size(F1,1)
    for n=1:size(F1,2)
        if(C(m,n)==0)
           F1(m,n)=B(m,n)-thr;
        end
    end
end


imshow(F1);
       end
    end
end


Shaded Image

Original Image


like button Like "IMAGE PROCESSING" page

Image Arithmetic in MATLAB with example

Image Arithmetic

    An image is represented in a matrix format.
    To perform image arithmetic the size of the two matrices should be same.
    The operation on two images results in a new image.
    Consider two images A and B with same size.


Image Addition

    In a RGB image, the addition of two images can be done using the ‘+’ operator. C=A+B;
Here, the minimum value of A+B and 255 is taken.

(i.e) C(i,j,1)=min(A(i,j,1)+B(i,j,1),255) where (i,j) represents the pixel position.
Image addition can be used to add the components from one image into other image.


Image Subtraction

A new image is obtained as a result of the difference between the pixels in the same location of the two images being subtracted.
C=A-B; ie. Maximum value of A-B and zero.
C(i,j,:) =max(A(i,j,:)-B(i,j,:),0).

Image subtraction is widely used for change detection.
For detecting the missing components in product assembly,
Example:To detect the defects in the PCB.


Image subtraction is most beneficial in the area of medical image processing called mask mode radiography.
   

Image Multiplication

Image multiplication is used to increase the average gray level of the image by multiplying with a constant.
It is used for masking operations.
C=A.*B;

Image Division

Image division can be considered as multiplication of one image and the reciprocal of other image.
C=A.\B;

Logical Operations:

Logical operations are done on pixel by pixel basis.
The AND and OR operations are used for selecting subimages in an image .
This masking operation is referred as Region Of Interest processing.

Logical AND

To isolate the interested region from rest of the image portion logical AND or OR is used. Consider a mask image L for the image A.
To obtain the interested area, D= and(L,A) ;
We can use L&A also.
The resulting image will be stored in D which contains the isolated image part.

Logical OR

Syntax: D=or(L,A). We can also use L|A


background=imread('back.jpg');
A=imread('tommy1.bmp');
B=imread('jerry1.bmp');

%Image addition
%Both A and B are of same size
object=A+B;


background=imresize(background,[size(object,1) size(object,2)]);
Im3=uint8(zeros(size(object)));
whiteImg=uint8(ones(size(object)));
%Array right division. A./B is the matrix with elements A(i,j)/B(i,j). A and B must
%have the same size, unless one of them is a scalar.
%Image Division
mask=whiteImg./object;
%Logical AND
im3=uint8(mask&background);%uint8(and(mask,background));
figure,imshow(mask);
%Array multiplication. A.*B is the element-by-element product of the arrays A and B.

%Image multiplication
%Multiply the background and the mask image
%And the result with the foreground image to obtain the final Image.
finalImg=(background.*im3)+object;
figure,imshow(finalImg);


Example:2
img61.jpg

Sample_Image.jpg

D=imread('img61.jpg');
E=imread('Sample_Image.jpg');
 D=imresize(D,[size(E,1) size(E,2)]);
 A=double(E);
 C=uint8(zeros(size(A)));
 F=E;


 [x,y]=find((A(:,:,1)+A(:,:,2)+A(:,:,3))>650);

 for i=1:size(x,1)
    C(x(i),y(i),:)=1; 
    F(x(i),y(i),:)=0;    
 end


 C=C.*D;

  
  C=C+F;
  imshow(C);


like button Like "IMAGE PROCESSING" page
Previous Post Next Post Home
Google ping Hypersmash.com