Lets Learn together... Happy Reading

" Two roads diverged in a wood, and I,
I took the one less traveled by,
And that has made all the difference "-Robert Frost

Simple Image Thresholding using GUI component Slider

Thresholding is one of the steps performed on the image during image conversion. 
Also Learn: Otsu's thresholding method
It is used for separating the background from the foreground.
The user can drag the slider to adjust the Thresholding. The slider value ranges between 0 and 255.

MATLAB CODE:


function f=mainthresh()
%The window size of the image is adjusted based on the screen size.


global T1;
ssz = get(0,'ScreenSize');
figure('Visible','on','Name','IMAGE THRESHOLDING','NumberTitle','off','Position',ssz);

axes('units','pixels','Position',[ssz(3)/45 ssz(4)/4 ssz(3)-(ssz(3)/4) ssz(4)-(ssz(4)/3)]);

in=imread('coins.png');
imshow(in);
set(gca,'xtick',[],'ytick',[])

%The Slider is one of the GUI component in MATLAB. The Value of the slider is between 0 and 255.
%These values can be changed based on the image type.


slid=uicontrol('Style','Slider','Visible','on','Value',1,'Max',255,'Min',0,'Sliderstep',[1 1],'Position',[ssz(3)/35 ssz(4)/5 ssz(3)-(ssz(3)/3) 20],'Callback', @threshing_image);
ent=uicontrol('Style','pushbutton','Visible','on','String','THRESHOLD VALUE','Position',[ssz(3)-(ssz(3)/4) ssz(4)-(ssz(4)/8) 105 30]);
ed=uicontrol('Style','edit','Visible','on','String','0','Value',1,'Position',[ssz(3)-(ssz(3)/4) ssz(4)-(ssz(4)/6) 90 20]);


%When the slider is moved the corresponding position value is passed to the function 'threshing_image' .

%The original image is passed to another function 'Imthreshold'.


      function threshing_image(object,~)
        val=get(object,'value');
        in=imread('coins.png');
        T1=Imthreshold(in,val);
        imshow(T1);
        set(gca,'xtick',[],'ytick',[])
       
        set(ed,'String',val);
      end


%Based on the value passed, the image background is separated from the foreground.

%In this example, the background of the coins image contains pixel values less than 80.
%By adjusting the slider to value 80 the background area gets value zero and the coins appear as it is.


function Im=Imthreshold(Image,Tvalue)

%Replace the pixel value either with 0 or 255.


Image( find ( Image(:,:,1) < Tvalue ) )=255;

Im=Image;
end
f=T1;
end


Thresholded Image


Here is another example , This Image is RGB. So we have to consider the RED, GREEN and BLUE pixel values.


like button Like "IMAGE PROCESSING" page

MATLAB PROGRAM : 2D MEDIAN FILTERING FOR SALT AND PEPPER NOISE WITHOUT USING medfilt2 FUNCTION

MEDIAN FILTER:

In digital Image processing, removing the noise is one of the preprocessing techniques.
The image noise may be termed as random variation of brightness or color information.
There are various types of image noise. Here a matlab program to remove 'salt and pepper noise' using median filtering is given.
 The random occurrence of black and white pixels is ‘salt and pepper noise’.

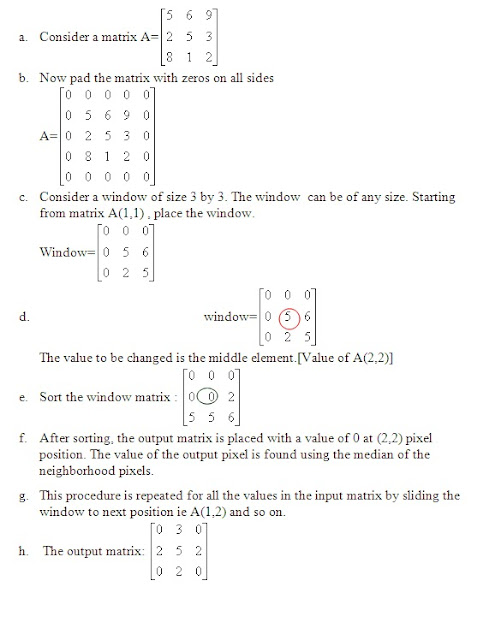
The procedural steps for 2D median filtering:


Learn how to pad with zeros using MATLAB built_in function padarray.

FLOW CHART:


MATLAB CODE:

%READ AN 2D IMAGE
A=imread('zebra.jpg');
title('IMAGE WITH SALT AND PEPPER NOISE');
figure,imshow(A);

%PAD THE MATRIX WITH ZEROS ON ALL SIDES
modifyA=zeros(size(A)+2);
B=zeros(size(A));

%COPY THE ORIGINAL IMAGE MATRIX TO THE PADDED MATRIX
        for x=1:size(A,1)
            for y=1:size(A,2)
                modifyA(x+1,y+1)=A(x,y);
            end
        end
      %LET THE WINDOW BE AN ARRAY
      %STORE THE 3-by-3 NEIGHBOUR VALUES IN THE ARRAY
      %SORT AND FIND THE MIDDLE ELEMENT
       
for i= 1:size(modifyA,1)-2
    for j=1:size(modifyA,2)-2
        window=zeros(9,1);
        inc=1;
        for x=1:3
            for y=1:3
                window(inc)=modifyA(i+x-1,j+y-1);
                inc=inc+1;
            end
        end
       
        med=sort(window);
        %PLACE THE MEDIAN ELEMENT IN THE OUTPUT MATRIX
        B(i,j)=med(5);
       
    end
end
%CONVERT THE OUTPUT MATRIX TO 0-255 RANGE IMAGE TYPE
B=uint8(B);
title('IMAGE AFTER MEDIAN FILTERING');
figure,imshow(B);


Learn how to add 'salt and pepper noise to an image'.Median filtering preserves the image without getting blurred. Median filtering is done on an image matrix by   finding the median of the neighborhood pixels by using a window that slides pixel by pixel.


    ALSO MEDIAN FILTER FOR RGB IMAGE
like button Like "IMAGE PROCESSING" page

SOLVING QUADRATIC EQUATION BY GRAPHICAL METHOD

                                                  Here is a simple example to solve quadratic equation. This is just the tenth grade mathematics. I wrote the code to solve it using MATLAB. Here I mainly focused on the GUI and the graph related to the equation.
Additional Information: To compute complex calculation use Texas Instruments.

function quad_eqn()
%Solving the quadratic equation by graphical method
%Quadratic equation is split into two representing two equations
%parabola and a straight line.
%The x-co-ordinates of the points of intersection of the parabola and the
%straight line will give the roots of the given quadratic equation.


clear all;
%global to the functions inside parabola()
global e1 e2 e3 g1 g2 g3 sol;


figure('units','pixels','position',[200 300 500 300],'menubar','none','numbertitle','off','resize','off','color','w');
title('SOLVING THE QUADRATIC EQUATION','fontsize',20,'fontname','Time New Roman','color','k');
axis off;
uicontrol('style','push','units','pixel','position',[10,200,220,30],'string','ENTER THE GRAPH EQUATION:');
uicontrol('style','push','units','pixel','position',[10,130,220,30],'string','ENTER THE EQUATION OF STRAIGHT LINE:');
sol=uicontrol('style','push','units','pixel','position',[10,60,220,30],'string','SOLUTION SET:');
set(sol,'Visible','off');


%Equation of a graph
uicontrol('style','edit','units','pixel','position',[240,200,40,30],'fontsize',14,'callback',{@graphx2});
uicontrol('style','push','units','pixel','position',[290,200,40,30],'string','x^2');
uicontrol('style','edit','units','pixel','position',[340,200,40,30],'fontsize',14,'callback',{@graphx});
uicontrol('style','push','units','pixel','position',[390,200,40,30],'string','x');
uicontrol('style','edit','units','pixel','position',[440,200,40,30],'fontsize',14,'callback',{@graphc});


%Equation to solve:
%Provide the input in each text box.
%If the co-efficient of x not present then give the value as 0.

uicontrol('style','edit','units','pixel','position',[240,130,40,30],'fontsize',14,'callback',{@equx2});
uicontrol('style','push','units','pixel','position',[290,130,40,30],'string','x^2');
uicontrol('style','edit','units','pixel','position',[340,130,40,30],'fontsize',14,'callback',{@equx});
uicontrol('style','push','units','pixel','position',[390,130,40,30],'string','x');
uicontrol('style','edit','units','pixel','position',[440,130,40,30],'fontsize',14,'callback',{@equc});


    function graphx2(source,event)
        g1=get(source,'string');
        
    end


 function graphx(source,event)
        g2=get(source,'string');
        
 end


 function graphc(source,event)
        g3=get(source,'string');
        
 end


 function equx2(source,event)
        e1=get(source,'string');
        
 end


 function equx(source,event)
        e2=get(source,'string');
        
 end


 function equc(source,event)
        e3=get(source,'string');
        
        solve();
    end


    function solve()
        %Initialize the variables
        inc=0;
        %preallocate the memory
        p=zeros(1,4);
        r=zeros(1,4);
      
    try
        %Convert the string into number  
      gr1=str2double(g1);
      gr2=str2double(g2);
      gr3=str2double(g3);
      eq1=str2double(e1);
      eq2=str2double(e2);
      eq3=str2double(e3);


      %Solving the two equations
        a=gr1-eq1;
        b=gr2-eq2;
        c=gr3-eq3;
        
    x=-10:10;   
    temp=power(x,2);
    y=(gr1*temp)+(gr2*x)+gr3;%ax^2+bx+c
     z=(a*temp)+(b*x)+c;
     
      catch
          display('ERROR OCCURRED');
          close all hidden;
          return
    end
     for i=1:21
        if(y(i)==z(i))
           inc=inc+1;
           p(inc)=y(i);
           r(inc)=x(i);
         end
     end
set(sol,'Visible','on');
if(inc==2)
     n1=num2str(r(1));
     n2=num2str(r(2));
     solset=strcat('{',n1,',',n2,'}');
     uicontrol('style','text','units','pixel','position',[230,60,200,30],'String',solset);
else
     uicontrol('style','text','units','pixel','position',[230,60,200,30],'String','none');
end
figure('units','pixels','position',[100 50 1000 650],'menubar','none','numbertitle','off','resize','off','color','w');


    plot(x,y);
    hold on
    plot(x,z);
    xlabel('X- axis');
ylabel('Y-axis');
title('GRAPH','fontsize',14,'color','k');
    if(inc>0)
      for i=1:inc;
        n1=num2str(r(i));
        n2=num2str(p(i));
        point1=strcat('(',n1,',',n2,')');
         text(r(i),p(i),point1);
      end
     end
    end


end


GUI

GRAPH

like button Like "IMAGE PROCESSING" page
Previous Post Next Post Home
Google ping Hypersmash.com